
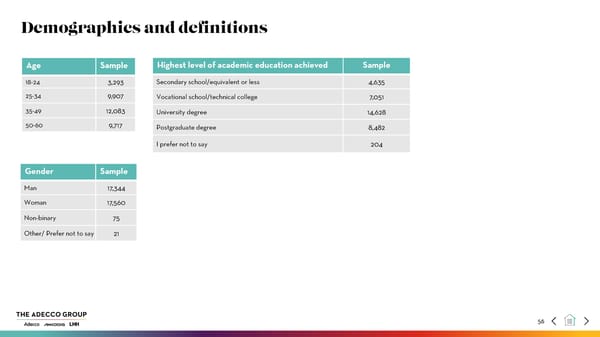
Demographics and definitions Age Sample Highest level of academic education achieved Sample 18-24 3,293 Secondary school/equivalent or less 4,635 25-34 9,907 Vocational school/technical college 7,051 35-49 12,083 University degree 14,628 50-60 9,717 Postgraduate degree 8,482 I prefer not to say 204 Gender Sample Man 17,344 Woman 17,560 Non-binary 75 Other/ Prefer not to say 21 56
 2024 | Working Through Change Page 55 Page 57